In this article I will show you how to make a beautiful yet simple graph using Django + Chart.js.
The code for this project is here.
Getting the data
We are going to plot the number of Bite exercises that get completed per month on our platform.
For this I exported the live data from the corresponding table in our database using this handy Postgres command:
postgres@0:pybites> \copy (select * from bites_table) to '~/Downloads/bites.csv' WITH (FORMAT CSV, HEADER)This will export the content of the table to a csv file.
Setting up Django
Next we will make a Django project and app so we can share it with this post:
$ mkdir bite_stats && cd $_
√ bite_stats  $ python3.10 -m venv venv && source venv/bin/activate
(venv) √ bite_stats  $ pip install django python-dateutil  # latter for date parsing
...
(venv) √ bite_stats  $ django-admin startproject mysite .
(venv) √ bite_stats  $ django-admin startapp stats
(venv) √ bite_stats  $ tree
.
├── manage.py
├── mysite
│   ├── __init__.py
│   ├── asgi.py
│   ├── settings.py
│   ├── urls.py
│   └── wsgi.py
└── stats
    ├── __init__.py
    ├── admin.py
    ├── apps.py
    ├── migrations
    │   └── __init__.py
    ├── models.py
    ├── tests.py
    └── views.py

3 directories, 13 files
Note the trailing dot (.) to the startproject command. I always do that in Django to not get the extra nested directory.
Create a model (database table)
Next let’s make the model that will hold the stats for our graph. I keep it very simple because the purpose of this post is to make a simple graph:
from django.db import models


class BiteStat(models.Model):
    exercise = models.PositiveSmallIntegerField()  # 0 to 32767
    completed = models.DateField()  # I don't care about time here
    level = models.PositiveSmallIntegerField(null=True, blank=True)  # optional, not every Bite has user feedback
I add the stats app to my INSTALLED_APPS in settings.py and run python manage.py makemigrations to make the migration file, then python manage.py migrate to sync it (and all other pending Django migrations) to the database.
Note we just use the standard sqlite3 database that Django provides out of the box.
Also note I did not update the secret key and other env variables, because this is a toy app example. Check this video how to do this in a regular Django project.
Django importer command
Next let’s get the stats csv loaded in using a Django command.
First make the required directory structure:
(venv) √ bite_stats $ mkdir -p stats/management/commandsThen make a module in that directory. The name you’ll give it will become the new switch to manage.py, I am going with stats/management/commands/import_stats.py so I can run it like: python manage.py import_stats
As per the docs we need to subclass BaseCommand and implement the handle() method.
I actually did a complete walk through of Django commands here.
I am adding a command line argument -c (--csv) to point the csv file on my computer.
Note that I parse the date string to a datetime object using python-dateutil and I need to convert rows without a user level to 0 to stay consistent with the column type:
import csv

from django.core.management.base import BaseCommand
from dateutil.parser import parse

from stats.models import BiteStat


class Command(BaseCommand):
    help = 'Import bite exercise stats'

    def add_arguments(self, parser):
        parser.add_argument('-c', '--csv', required=True)

    def handle(self, *args, **options):
        file = options["csv"]
        with open(file) as f:
            reader = csv.DictReader(f)
            for row in reader:
                completed = row["first_completed"]
                if not completed:
                    continue

                level = row["user_level"]
                if not level:
                    level = 0

                date = parse(completed)
                stat, created = BiteStat.objects.get_or_create(
                    exercise=row["bite_id"],
                    completed=date,
                    level=level,
                )

                if created:
                    self.stdout.write(f"{stat} created")
                else:
                    self.stderr.write(f"{stat} already in db")
Some more observations:
- We get the command line arg through the
optionsdict. csv.DictReader()is really nice to load in a csv file and associate each row with the column names (keys).- Django ORM’s
get_or_create()is a nice helper to only create the object if it does not exist yet. This makes the script idempotent (I can run it again without getting duplicate records). - We use the super class’
stdoutandstderrobjects for nicer output formatting.
Let’s run it:
python manage.py import_stats -c ~/Downloads/bites.csvThis is literally scrolling over the terminal for a good while as I am writing this, lot of Bites completed on our platform 🎉
Let’s now plot this data in a simple view using Chart.js …
Create a route to a new view
I am creating a view and route first:
from django.contrib import admin
from django.urls import path

from stats import views

urlpatterns = [
    path('', views.index),  # new
    path('admin/', admin.site.urls),
]
To keep it simple I just do this in the main router (urls.py), not making a new one at the app level.
Create a view to get the data and link to a template
In stats/views.py I create a simple (function based) view to retrieve the records we just imported and build up the x and y values for the graph.
Btw I much prefer function based views over class based ones, see this resource why …
from collections import Counter
from math import ceil

from django.shortcuts import render

from stats.models import BiteStat


def index(request):
    stats = BiteStat.objects.order_by('completed')

    data = Counter()
    for row in stats:
        yymm = row.completed.strftime("%Y-%m")
        data[yymm] += 1

    # unpack dict keys / values into two lists
    labels, values = zip(*data.items())

    context = {
        "labels": labels,
        "values": values,
    }
    return render(request, "graph.html", context)
For counting things collections.Counter() is a Standard Library staple and zip(*list_of_tuples) is a nice way to unpack values to a list of labels + values.
Create the template with the graph using Chart.js
I render a graph.html template we’ll create next. I put this template in mysite/templates, a directory I created.
I took the basic example from the docs page, linked to the library using its CDN, and used Django’s templating language to populate the labels and data attributes as per the (context) variables passed in from the view.
Note that normally we would abstract repeated template code in a base.html and use inheritance. I just used a single template to keep things simple.
<!DOCTYPE html>
<html>
<head>
<title>Bite exercise stats</title>
</head>
<body>

  <canvas id="myChart" width="800" height="400"></canvas>
  <script src="https://cdn.jsdelivr.net/npm/chart.js"></script>
  <script>
  const ctx = document.getElementById('myChart').getContext('2d');
  const myChart = new Chart(ctx, {
      type: 'bar',
      data: {
        labels : [{% for item in labels %}"{{ item }}",{% endfor %}],
          datasets: [{
            label: "Bite exercises complete per month",
            data : [{% for item in values %}{{ item }},{% endfor %}],
            backgroundColor: 'rgba(75, 192, 192, 0.2)',
            borderColor: 'rgba(75, 192, 192, 1)',
            borderWidth: 1
          }]
      },
      options: {
          scales: {
              y: {
                  beginAtZero: true
              }
          }
      }
  });
  </script>

</body>
</html>
In order for Django to find this template I put the path to the template directory to DIRS in the TEMPLATES list in settings.py:
TEMPLATES = [
    ...
    'DIRS': [Path(BASE_DIR) / 'mysite' / 'templates'],
    ...
Again check out the source code of this project in this repo.
The resulting graph
Now let’s run python manage.py runserver and see if it works …
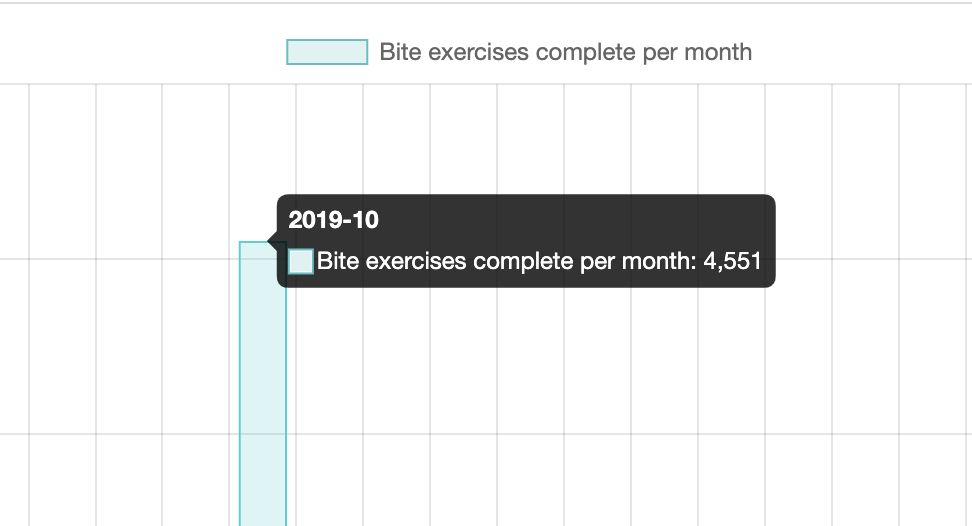
Navigating to localhost:8000 I see this – sweet!
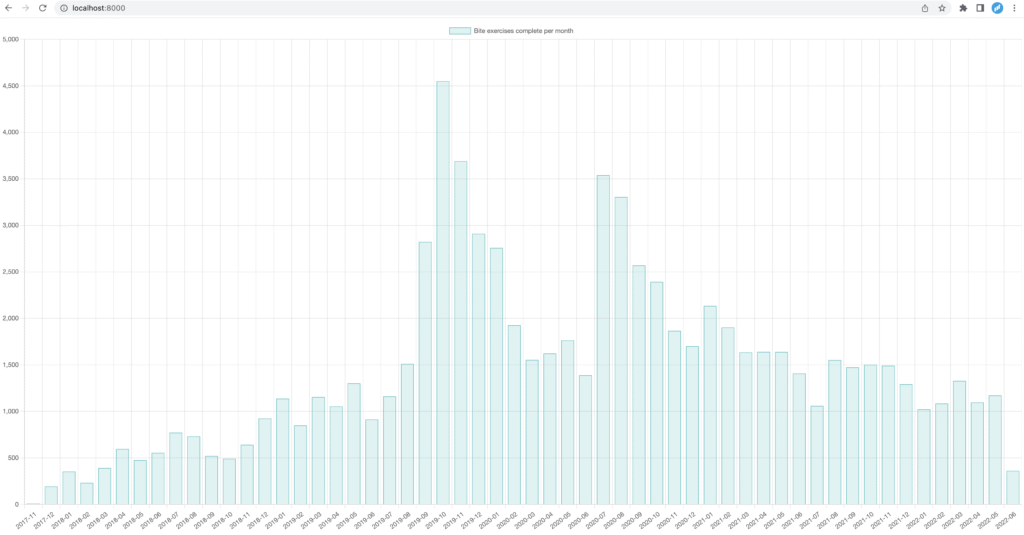
Wrap up
Cool! There are two peaks, what were those? It turns out those were the two months we participated in some massive Humble Bundle promotions where we offered Bite exercise packages.
A lot of people signed up to the platform then and started to redeem their Bite tokens and hence code the Bites. It’s really cool to see those trends using data visualization.
Overall we’re blown away with a steady rate of > 1K exercises being solved every month!
So there you go, I hope this gave you a little template you can use to easily build your own graph using Django.
We challenge you!
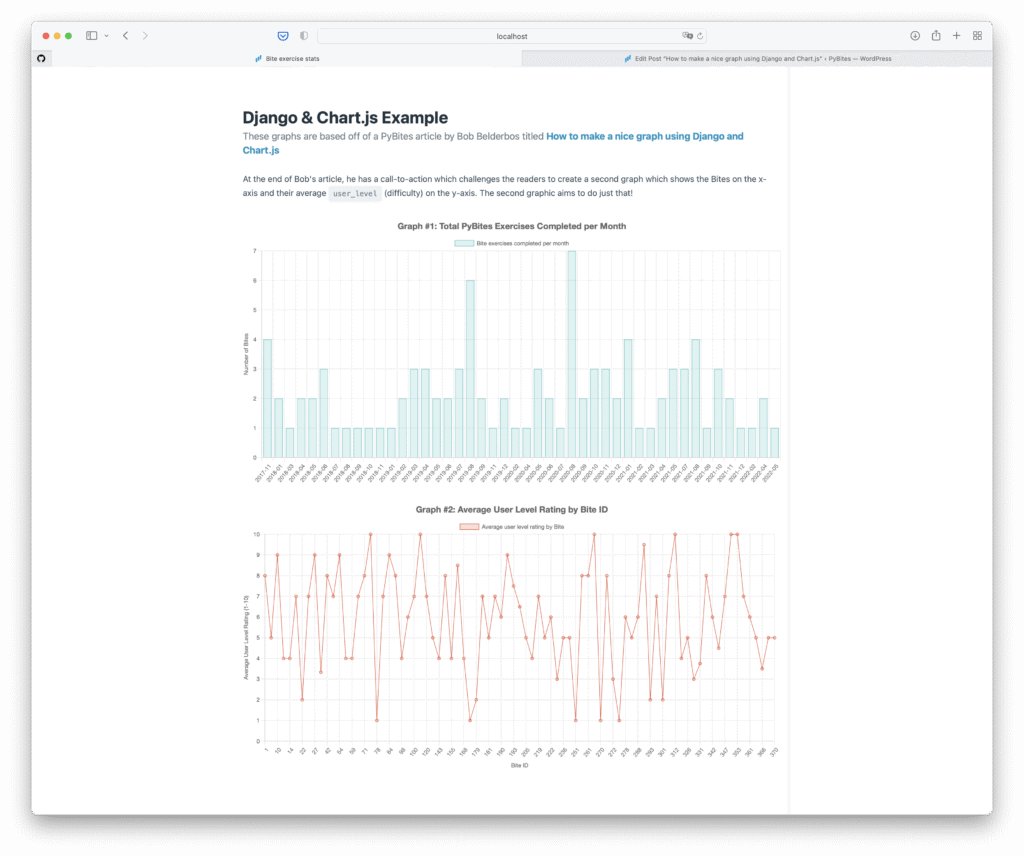
Note that I also imported the user_level (scale 1-10) per Bite. What if you create a second graph to show the Bites on the x-axis and their average user_level (difficulty) ratings on the y-axis?
Remember deliberate practice is key, so it’s time to fork the repo and get your hands dirty 🙂
Feel free to PR (pull request) your solution … 💪
Thanks Kirk
Kirk Davis was so nice to open a PR for this second graph. He also added the ability to generate some fake Bite stats:
">$ python manage.py generate_fake_stats -n 100
Creating 100 new fake records...
Successfully created 100 new fake records.
The merged PR is here.
Look at the cool webpage we see now 😍
Platform stats
A few weeks after writing this article, I ported this graph code to our platform. Now you can see two nice graphs:
1. How your score evolved over time and when you got your Ninja Belts (note I have dark mode turned on):
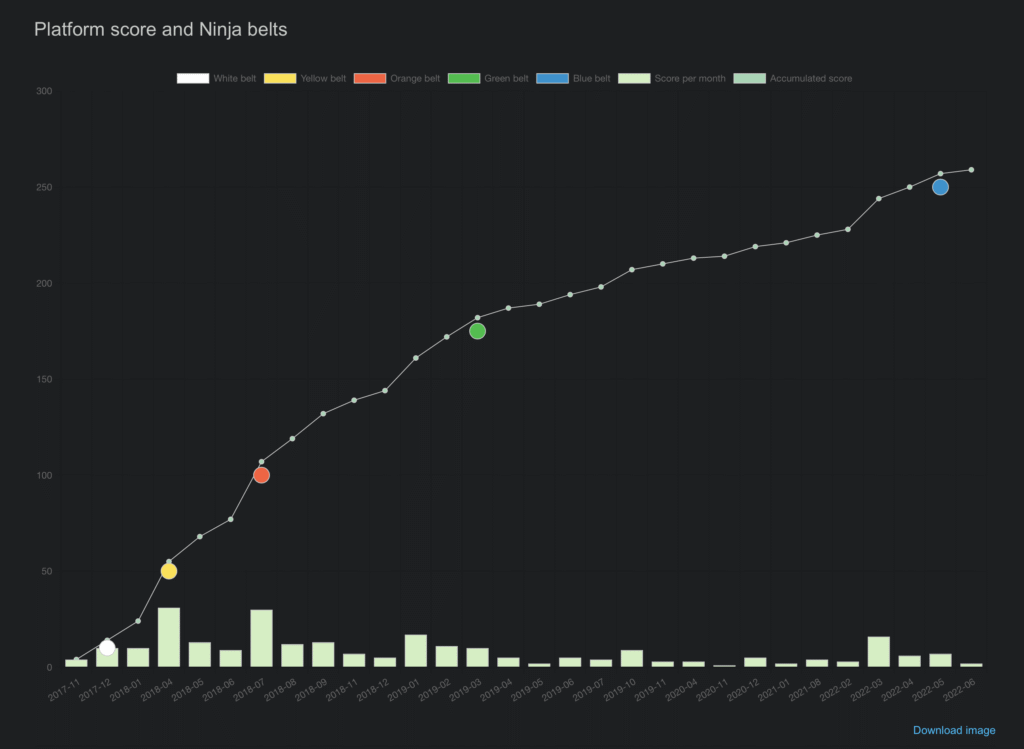
2. A radius graph (thanks for the idea Cedric) where you can see your progress towards each Learning Path on our platform:
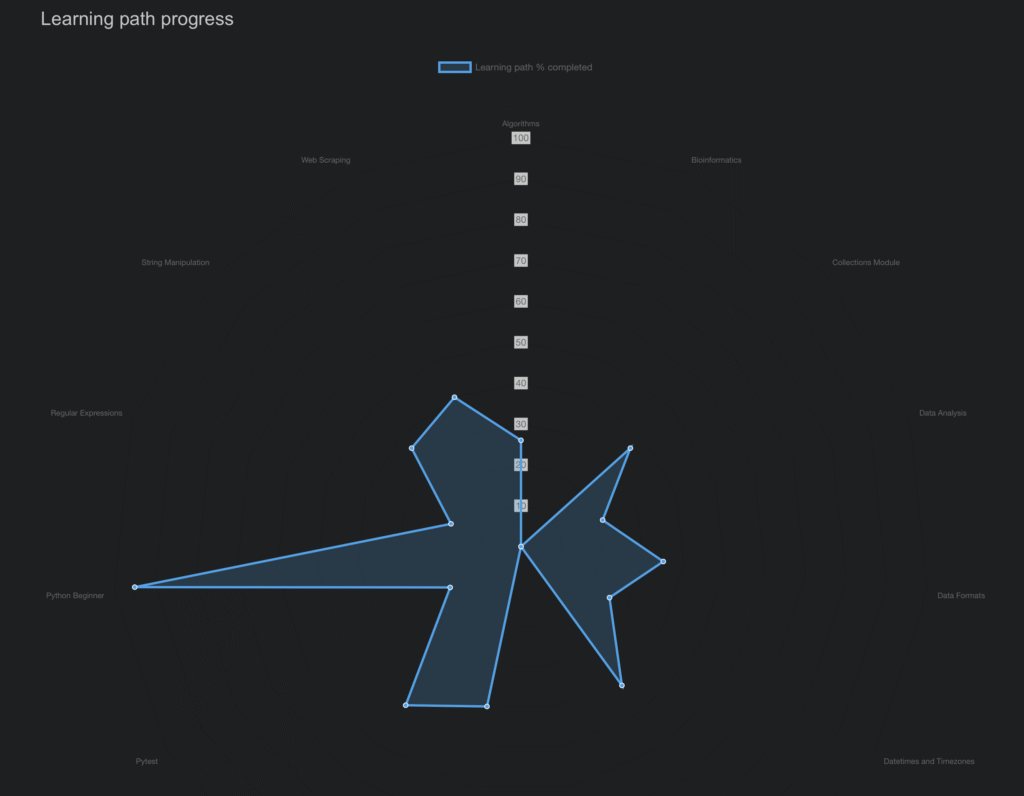
To see what these look like for you, just go to: https://codechalleng.es/performance
Keep calm and code in Python!
– Bob