In this article I use the metric system, where 1 meter = 3.28 feet. I also talk about highways. Here I use the definition in British English, where highway refers to any path with a public right of access.
We are all familiar with the existence of route planners like google maps or OpenStreetMaps (OSM), that allows us to get the shortest path between two points in space. With OSM and it’s read-only API Overpass we can get very detailed information about a chosen region, including streets roads and ways, but also information like if a street is illuminated, if a bus stop has a bank or which bars are in the region. This opens the door to the possibility to not only calculate a route based on distance, but also to use other criteria like prioritizing illuminated streets or the estimated quietness, so I wrote a web application to do exactly this.
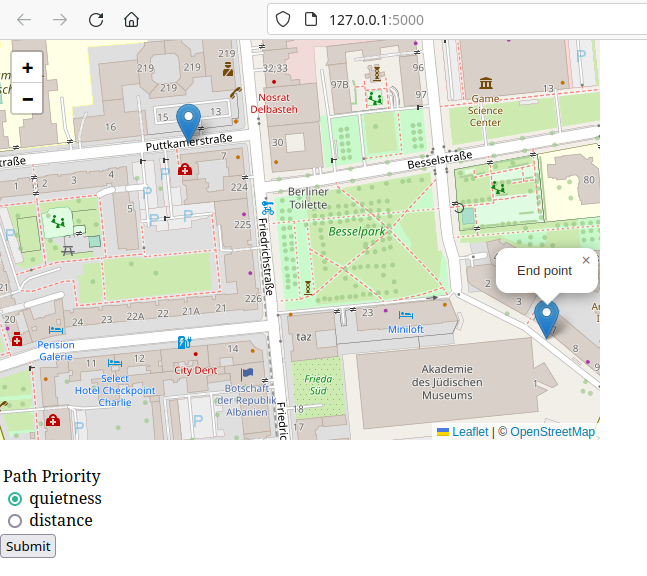
How does this app look like?
You can find the application deployed here.
To use it, first of all we have to scroll the Map to the position we want to get our way. Then we need to click the two points on the map where we want to have our start and end point. On Path Priority we can select to get the quietest path or the shortest one, where the quietness option is the default one.
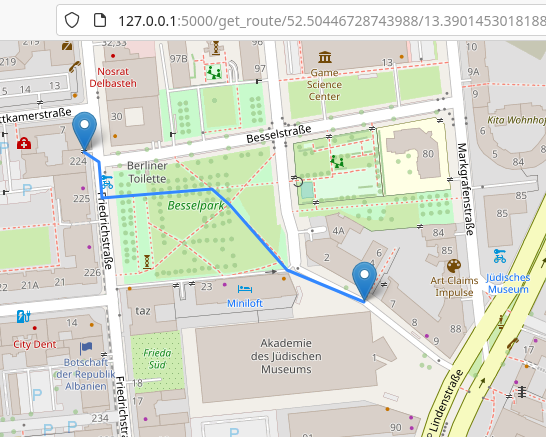
After clicking on Submit a new tab opens with the calculated route.
How does this App work?
This seems very simple on the surface, but what is on the inside?
Getting the data for the desired area
To build all functionalities First of all we use Leaflet and Javascript to display the map and write the functionality for the markers.
With the markers we can get the coordinates of the desired start and end points.
Downloading the map data
The first thing we need to find a route between the two points on the map is the data of the map! With Overpass API we can query the data we need from OSM:
">[out:json];
way(south, west, north, east)[highway];
(._;>;);
out;
South, west, north and east stand for the coordinates limiting the area we want to download. How Overpass works would be a blog article for itself, but in this case we get all ways inside of the area bounded by the given coordinates and who contain data on highway. In addition we get a list of nodes contained in the ways. In python, we execute the query with the following (simplified) code:
import requests
OVERPASS_URL = 'https://overpass-api.de/api/interpreter'
OVERPASS_QUERY = '''
[out:json];
way({s},{w},{n},{e})[highway];
(._;>;);
out body;
'''
overpass_query = OVERPASS_QUERY.format(n=self.area_boundaries.north,
s=self.area_boundaries.south,
e=self.area_boundaries.east,
w=self.area_boundaries.west)
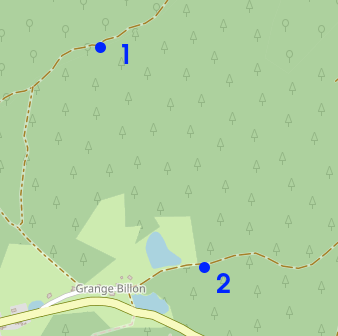
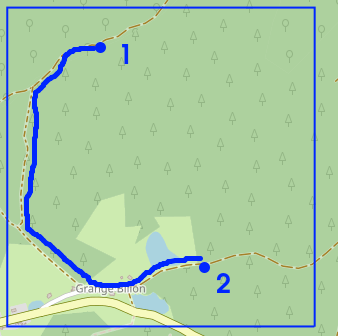
response = requests.get(OVERPASS_URL, params={'data': overpass_query})I decided to enhance the boundaries of the downloaded area because following scenario could happen. Imagine we want to find a path between points 1 and 2. If we didn’t add a “margin” to the boundary marked by the points, we would only get the data inside the box on figure 2. In this case it implies that the application wouldn’t find a path between the two points, despite one existing!
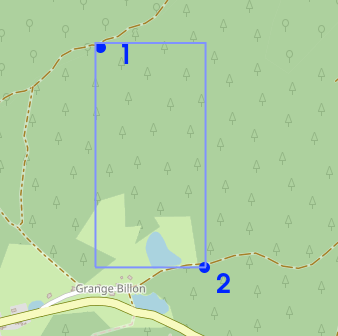
By adding a margin we get the data for the way between 1 and 2, as shown in figure 3.
Parsing the data and creating the graph
Once the data is downloaded, it has to be parsed. The data contains a list of node with the latitude and longitude coordinates where they are located, and a list of way containing data for highway and a list of the node id’s forming the way.
| Node1 id1 lat1, lon1 | Node2 id2 lat2, lon2 | … | Way1 highway:type1 nodes: id1, id2, … | Way2 highway: type2 nodes: idi, idj, … | … |
With this information we know which nodes are directly connected. For the edges we need to calculate the weight. Depending on if we want to get the shortest path or the (estimated) quietest one, we need different information in order to calculate the weight of the edges.
Calculating the distance
In order to get the shortest path, we can just take the distance between two connected nodes. Since we have the coordinates of each node, we can just use the haversine library:
from haversine import Unit, haversine
# Some more code
coordinates_0 = (node_0.lat, node_0.lon)
coordinates_1 = (node_1.lat, node_1.lon)
haversine(coordinates_0, coordinates_1, unit=Unit.METERS)
This way we don’t need to implement the formula ourselves, which is quite complicated.
Estimating the quietness
To estimate the quietness, things become more complicated. The downloaded and parsed information includes the highway. The highway tells us which kind of road we have, for example if it’s residential or a motorway. Most interestingly, OSM does not save which type a road has been officially classified but rather which type it really is.
Different types of paths will have a different amount of traffic, which results in more or less sound volume. For example, a track in the middle of a forest will be quieter than a road with 6 lanes crossing a big city. With this information we can guess that a way classified as track will be quieter than a way classified as trunk.
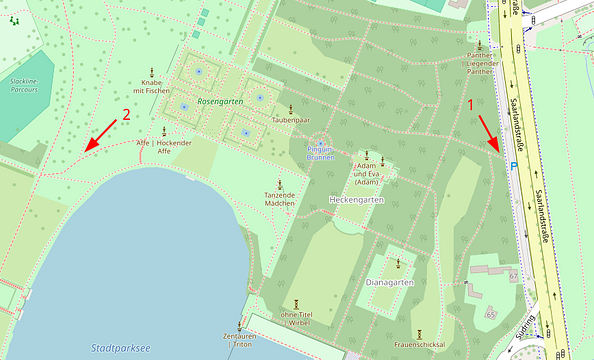
Using that approach alone is a good start, but it has a problem: a footpath located directly next to a road is being estimated as being as quiet as the ones located far away of roads. As we can see in the picture below, the way starting on point 1 is of the same type as on point 2. However point 1 is directly next to a secondary road while point 2 is located in the middle of a park. If we don’t take into account the surroundings, we would be classifying the edges forming both ways as being equally quiet, making the estimation very imprecise.
To solve this problem, we can take into account everything we have in a certain radius. For now I took 20 meters, which after some tests it seems to allow a better estimate than if I take 10 meters.
Calculating the path and displaying it
Once we have the weights of the edges, we can construct the graph with the help of the dijkstra library.
from dijkstra import Graph
# More code
graph = Graph()
weight_calculator = WeightCalculator(self.path_way_priority, self.nodeId_to_nodeInfo_dict)
for node_id_0, node_id_1 in self.edge_list:
    weight = weight_calculator.get_weight(node_id_0, node_id_1)
    graph.add_edge(node_id_0, node_id_1, weight)
    graph.add_edge(node_id_1, node_id_0, weight)
return graph
The weight calculator allows us to get the weight of an edge depending on if we need to take into account the distance or the estimated quietness. For each connected node pair, we calculate the weight of the connecting edge and add those into the graph.
Later we use the following code to get our path:
from dijkstra import DijkstraSPF
# More code
# Use graph object from above
dijkstra = DijkstraSPF(graph, init_point)
# Even more code
dijkstra.get_path(end_node_id)
Finally we want to display it to the user using the folium library. Folium allows us to create html files where we display a map using OSM and displaying elements on said map. On the one hand we want to get the trail coordinates, which allows us to display the calculated route. dijkstra.get_path(end_node_id) returns a list of nodes, so we can use that list to get the list coordinates (latitude, longitude) to display said trail coordinates.
map = folium.Map(location=start_node_coords, zoom_start=ZOOM_START)
# etc
# Returns a list of nodes forming the calculated path between the init and end node
nodes_forming_path = dijkstra.get_path(end_node_id)
# returns a list of tuples containing the coordinates of the nodes
trail_coordinates = self.get_trail_coordinates(nodes_forming_path)
folium.PolyLine(trail_coordinates).add_to(map)
With the following code we add the start and end marker:
folium.Marker(start_node_coords, popup='Start').add_to(map)
folium.Marker(end_node_coords, popup='End').add_to(map)
After all this we are ready to save the map and display it to the user.
Possible improvements and enhancements
It would be an improvement to make the radius for the estimated quietness weighted. This means that objects located at for example 15 meters away from the “starting node” would be less relevant as those located 2 meters away.
This application can potentially be enhanced to offer other criteria to calculate a path. Not only does it allow to help people reduce the amount of noise one is exposed, but it can add safety by prioritizing illuminated ways. Maybe it can also be used to get a friendlier path for people with mobility issues or suffering from fatigue. What cool enhancements can you think about?