It’s end of the week again so we review the code challenge of this week. It’s never late to join, just fork our challenges repo and start coding.
Possible solutions / learning
1. Moving average using PyPI’s RSS
My first approach was to take the PyPI New RSS feed and take the average of time between adding packages. The script is here. The problem though is that the RSS feed has only 40 items, not much data. However when I put it in a cronjob and left it running for a week I got pretty similar results: it will happen somewhere at the beginning of March:
# grep Result pypi.log |sed 's/,.* \[Main.*: /   /g'
2017-02-09 16:09:13   2017-02-25 13:52:23.701848
2017-02-10 15:57:03   2017-02-26 03:50:38.528795
2017-02-11 15:57:03   2017-03-09 23:10:14.631885
2017-02-12 15:57:03   2017-03-05 22:31:50.575452
2017-02-13 15:57:03   2017-02-27 07:02:47.599206
2017-02-14 15:57:03   2017-02-21 20:41:34.775090
2017-02-15 15:57:03   2017-02-25 00:01:30.304754
2017-02-16 15:57:03   2017-03-01 12:52:38.659931
2017-02-17 08:00:33   2017-03-01 09:38:01.360349
Another source to use if you go this route is PyPI’s XML-RPC methods.
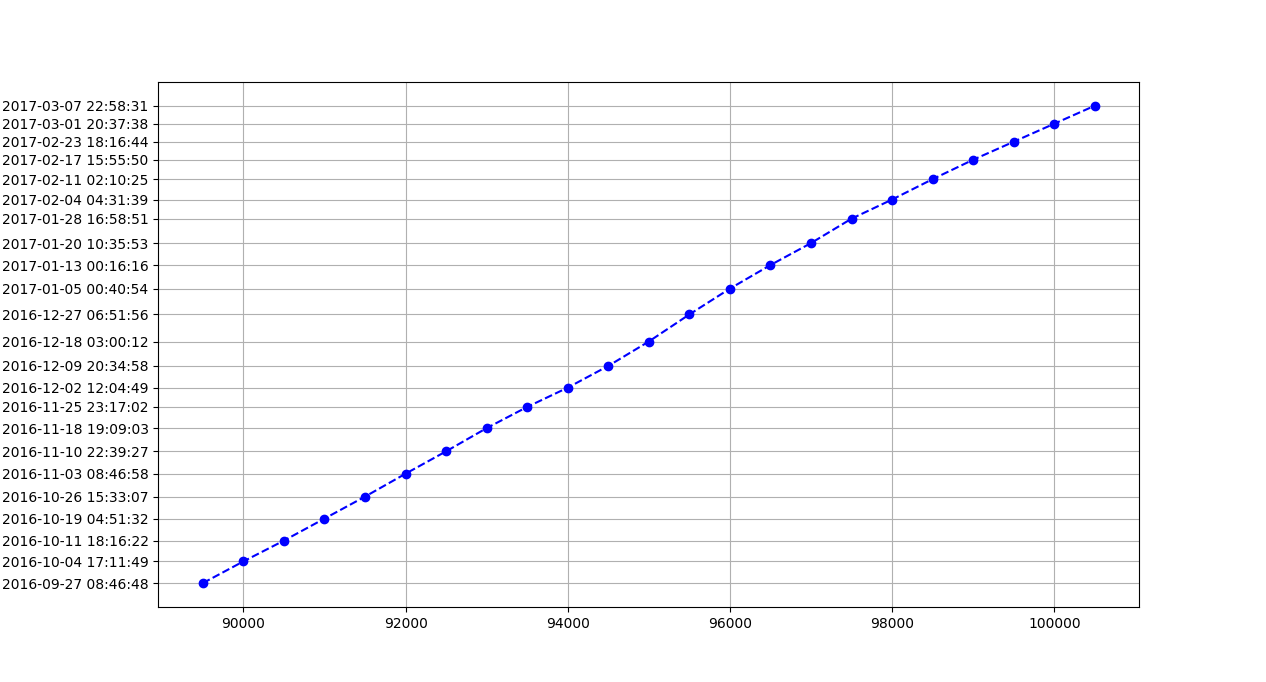
2. Using scipy.interpolate on Webarchive data
I was pointed to the Web Archive on Reddit. This is how you get snapshots of the PyPI page over time == a set of date points and how many packages there were at each time.
$ python -m venv venv && source venv/bin/activate
$ pip install waybackpack
# take 4 years of data (half a GB, delete when done)
$ waybackpack https://pypi.python.org/pypi -d pypi-snapshots --from-date 20130214 --to-date 20170214
# few days went by, adjusted end date to 20170217 today
#
# prep the data
$ cd pypi-snapshots
# sometimes unix is all you need ;)
$ find . -name 'pypi'|xargs grep "[0-9][0-9]*"| perl -pe 's/.*?(\d+)\/.*(\d+)<\/strong>/\1:\2/g' > ../data.txt
$ head -2 data.txt
20130214002304:28061
20130216031420:28108
$ tail -2 data.txt
20170215124232:98825
20170216124236:98907
This data (and all scripts) are on our solutions branch.
I made this notebook with the analysis. I used scipy.interpolate – UnivariateSpline to do the extrapolation, I found this here (Joma’s answer).
My prediction
As you can see from the notebook I am getting: 1st of March 8:37 PM. First of the month, nice date. And consistent with the first method.
Feedback
What was your solution? Feel free to share in the comments below.
We hope you enjoy these challenges. Please provide us feedback if we can improve anything …
If you have an interesting challenge you want us to feature, don’t hesitate to reach out to us.
next(challenges)
Next week we return to the Twitter API to do a sentiment analysis! Stay tuned …
Update 9th of March 2016
OK so turns out the 1st of March was a bit optimistic, predicting is hard 🙂
The best / winning solution with nice Bokeh visuals can be found here. Although it displays the current date now, it had the right predicted date of the 4th of March before 100K was reached.
PyBites celebrated closely after hitting this important milestone:
It’s official! PyPI has hit 100,000 packages! Woohoo!! #Python #milestone @TalkPython @pybites https://t.co/jqDoWsjfyR
— Pybites (@pybites) March 05, 2017